
|
Conditional Probability
|

|
Venn Diagrams are a familiar way of representing data.
In the Venn diagram below, 50 students were asked if they were taking a foreign language and if they played a sport. You can see the individual data but extra work needs to be done to find the totals. So Venn Diagrams are more useful when comparing data visually.
In the Venn diagram below, 50 students were asked if they were taking a foreign language and if they played a sport. You can see the individual data but extra work needs to be done to find the totals. So Venn Diagrams are more useful when comparing data visually.
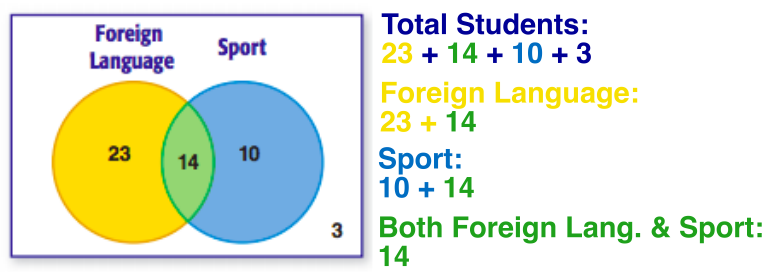
Venn Diagram
Below, the same data is represented in a frequency table or a 2-way table. You can see the same values are displayed but each category is totaled. This representation allows you to see more information.
For example. We can see that 37 out of the 50 students are taking a Foreign Language, or 24 out of the 50 students play a sport.
Since more information can be seen, the frequency tables are very useful when finding probabilities of events.
For example. We can see that 37 out of the 50 students are taking a Foreign Language, or 24 out of the 50 students play a sport.
Since more information can be seen, the frequency tables are very useful when finding probabilities of events.
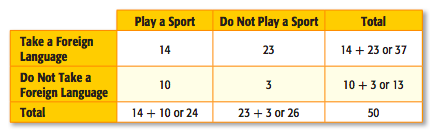
Two-Way Frequency Table
Conditional probability can also be calculated using two-way tables.
Conditional Probability: the probability of an event, given some other event has already occurred.
These events fall within the individual rows and columns of the table.
For example, given that a student is chosen that does not play a sport, what is the probability that they also do not take a foreign language?
P(No Sport) = 26
P(No Sport and No Foreign Language) = 3
Three out of the 26 students who do not play sports also do not take a foreign language.
So the probability is 3/26 or 0.12 or 12%.
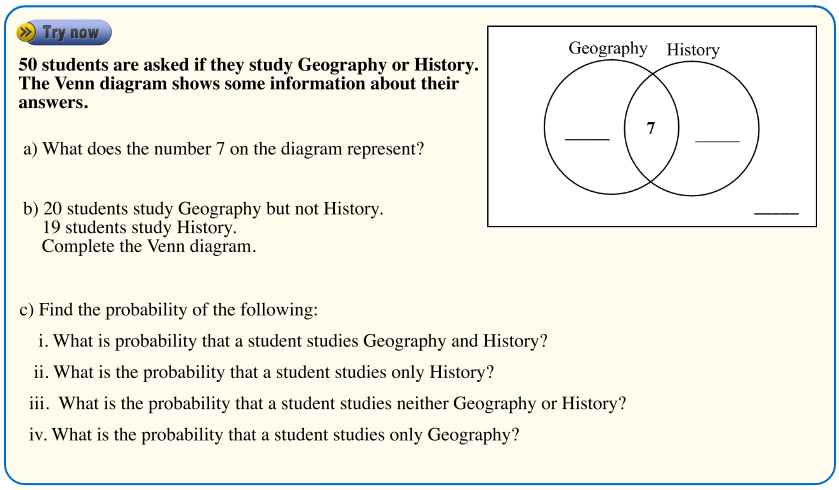
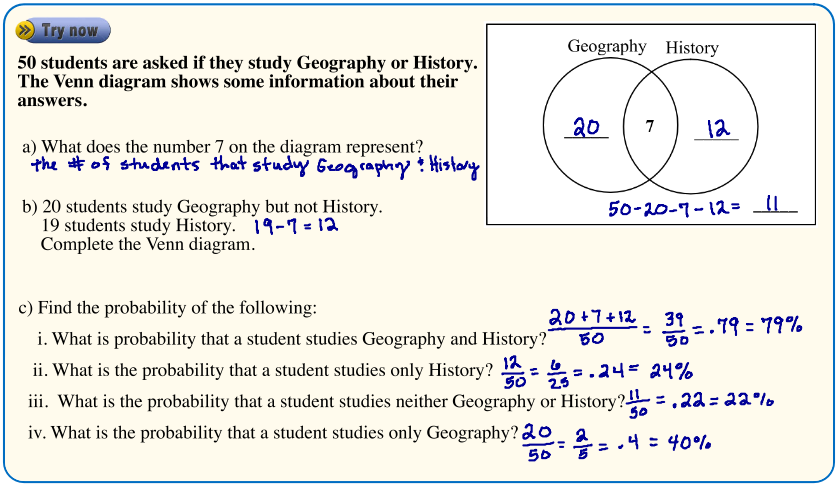
Watch the video below, then complete the two examples problems and check your answers.
Conditional Probability: the probability of an event, given some other event has already occurred.
These events fall within the individual rows and columns of the table.
For example, given that a student is chosen that does not play a sport, what is the probability that they also do not take a foreign language?
P(No Sport) = 26
P(No Sport and No Foreign Language) = 3
Three out of the 26 students who do not play sports also do not take a foreign language.
So the probability is 3/26 or 0.12 or 12%.
Watch the video below, then complete the two examples problems and check your answers.

|
|
|
|
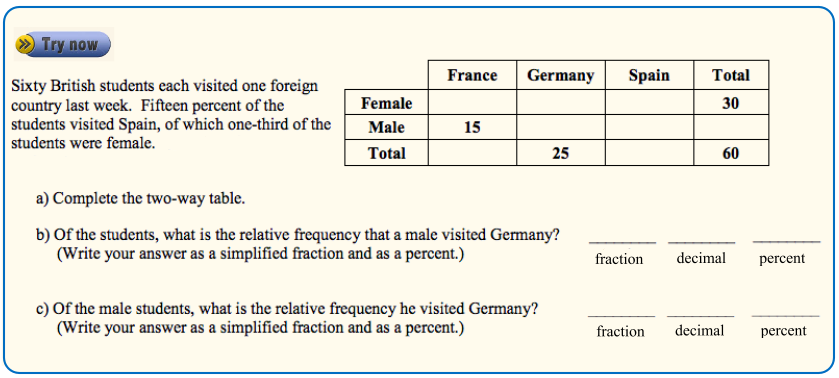
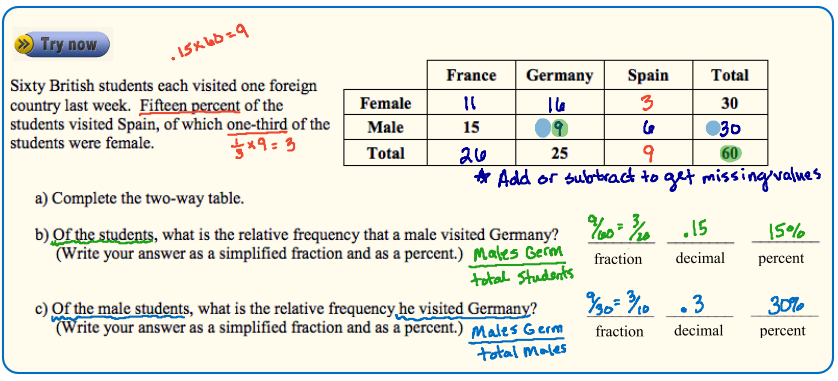
Complete the following worksheet linked below, then check your answers.

|

|

|

|
