|
Modeling With Quadratic Functions |

|
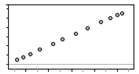
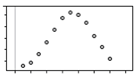
You will now be finding quadratic functions rules to model a set of given data. Think of the scatter plots from math 1. You identified the line of regression for a set of given points, and used it to make predictions. The same can be done with quadratic regression models. See the scatterplot below and how it resembles a quadratic function. Watch the video below to learn how to put in the data points, find the regression equation and how to use it.
Linear Regresssion
|
Quadratic Regression
|

|

|
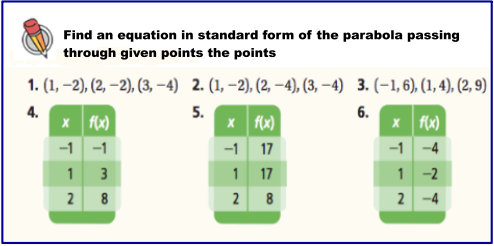
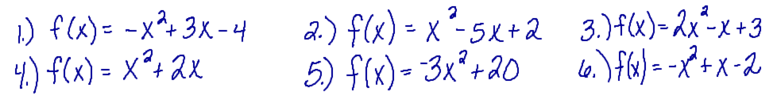
In the 6 questions below you will be practicing using the calculator to find the regression equations. Check you answers when you have finished.
|
|
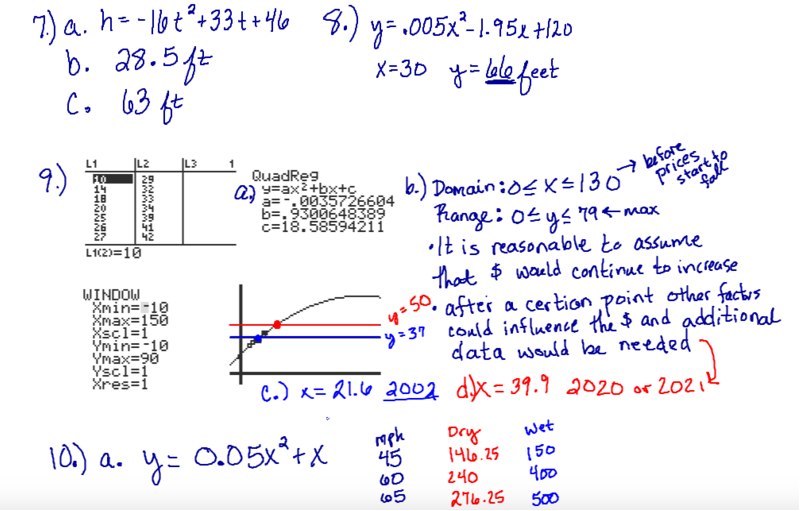
Now try the application problems. The process remains the same, but once you find the equation you will use it to make predictions.

|
|
